
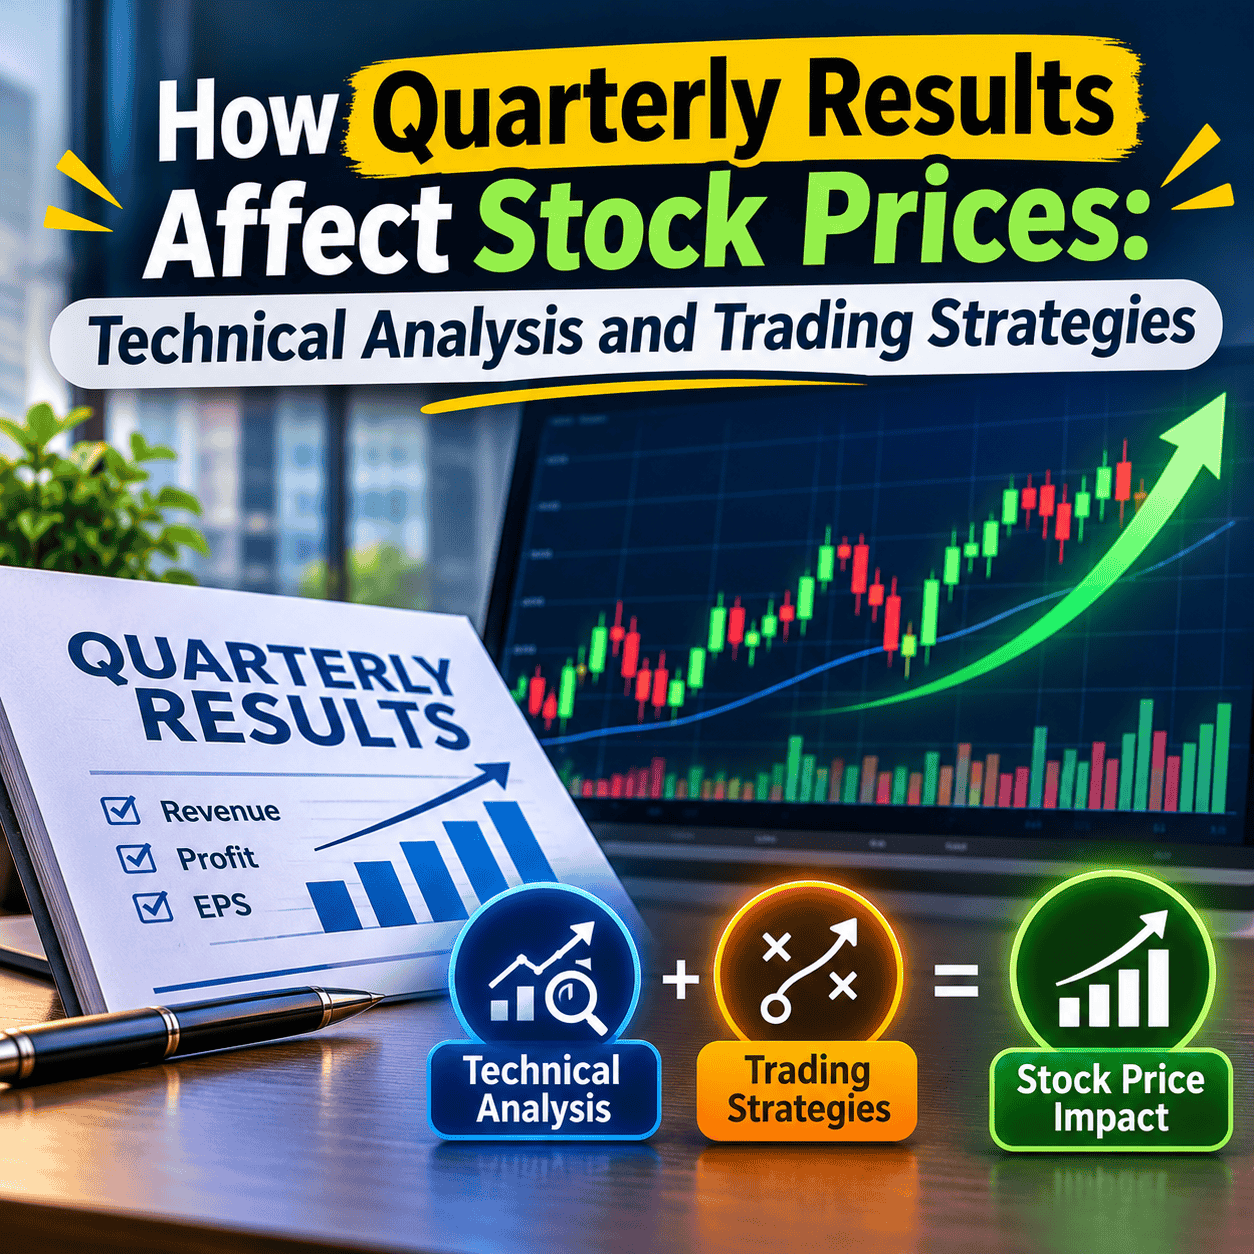
Quarterly financial results are among the most closely watched announcements in the stock market. Revenue growth, profitability and management guidance can influence investor expectations, leading to significant stock price movements.
However, understanding earnings reports alone is not enough. Combining fundamental insights with technical analysis for stock trading helps market participants assess price trends, trading volume and potential risks.
This article explores how quarterly earnings influence market behaviour and how traders interpret these movements using technical indicators.
How Do Quarterly Results Affect Stock Prices?
Companies release quarterly financial statements outlining their performance over three months. Investors typically examine revenue, net profit, earnings per share (EPS), operating margins and management commentary.
However, stock prices respond not only to reported performance but also to how results compare with market expectations.
Three common scenarios explain these reactions:
- Better-than-expected earnings: Strong results may attract buying interest, potentially pushing prices higher.
- Below-expectation earnings: Disappointing performance can trigger selling pressure and price declines.
- Future guidance: Even strong quarterly earnings may coincide with falling stock prices if management forecasts weaker future performance.
Investors can examine official announcements through the National Stock Exchange (NSE) Corporate Filings platform.
Technical Analysis for Stock Trading During Earnings Season
While financial statements explain business performance, technical analysis examines how market participants respond through price and volume.
Applying technical analysis for stock trading around earnings announcements involves observing several indicators.
1. Support and Resistance Levels
Support represents a price region where buying interest may emerge, while resistance indicates an area where selling pressure could increase.
Following quarterly results, a stock breaking above resistance or falling below support may signal a change in market sentiment.
2. Moving Averages and Price Trends
Moving averages help traders identify broader trends and reduce the impact of short-term price fluctuations.
Comparing post-earnings prices with commonly used moving averages can help assess whether an existing trend is strengthening or weakening.
3. Trading Volume Analysis
Trading volume analysis measures market participation during price movements.
For example, a sharp price increase accompanied by unusually high trading volume may suggest stronger market interest than a similar movement on low volume.
However, increased volume does not guarantee that a trend will continue.
Stock Trading Strategies Around Quarterly Results
Earnings announcements create opportunities for studying market behaviour, but they also introduce uncertainty.
Common stock trading strategies include:
Pre-Earnings Trend Analysis
Traders examine historical price movements and prevailing trends before results are announced. However, unexpected earnings can quickly reverse existing patterns.
Post-Earnings Breakout Analysis
Some traders wait for the initial market reaction before evaluating whether prices have moved beyond established support or resistance levels.
Momentum-Based Analysis
Traders assess whether price momentum continues after an earnings announcement. This may involve observing trend strength, moving averages and trading volume.
Risk Management
Stop-loss planning, position sizing and predefined risk limits are essential considerations because earnings-related volatility can produce sudden price gaps.
For additional foundational concepts, explore FinX Institute's blog on Stock Market Courses for Beginners: What You Will Learn and How to Get Started.
Understanding Post-Earnings Volatility
Quarterly announcements can cause sharp fluctuations as investors reassess company valuations.
Some stocks experience post-earnings announcement drift, where price movements continue in the direction of the initial earnings surprise.
Options markets may also experience a decline in implied volatility after results are released, commonly called a volatility crush.
These patterns are not guaranteed. Unexpected developments, market sentiment and broader economic conditions can influence outcomes.
Develop Market Analysis Skills with FinX Institute
Understanding quarterly earnings requires interpreting financial information alongside technical indicators and market psychology.
The Certified Market Expert (CMX) Programme offered by FinX Institute (formerly BSE Institute Ltd.) provides 120 hours of structured learning covering stock investing, technical analysis, price action, chart patterns, and derivatives strategies.
Designed for aspiring market participants and working professionals, the programme connects market concepts with practical analytical approaches.
Take the next step towards building your financial market expertise.
Explore the Certified Market Expert Programme – Enquire Now